目录
1、 简介
本文将介绍如何安装配置Prometheus并且集成各类的exporter,实现监控、告警功能,Prometheus官方文档地址:https://prometheus.io/docs/introduction/overview/。
1、Prometheus、Grafana的部署、配置等
2、主机监控(node_exporter)
3、Redis监控(redis_exporter)
4、MySQL监控(mysqld_exporter)
……
监控告警项目架构

2、Prometheus部署
Prometheus 是一个开源的监控系统,具有强大的时间序列数据存储和查询功能。它使用拉取模型从配置的目标中收集指标数据,适合于动态环境(如微服务架构)
1、下载
shellwget https://github.com/prometheus/prometheus/releases/download/v2.37.8/prometheus-2.37.8.linux-amd64.tar.gz
2、解压
shell# 解压
tar xf prometheus-2.37.8.linux-amd64.tar.gz
#重命名
mv prometheus-2.37.8.linux-amd64 prometheus-2.37.8
#进入
cd prometheus-2.37.8
3、创建服务启停文件
vi
server.sh
shell#!/bin/bash
OUTPUT_DIVISION='--------------------------------------------------'
TODAY=`date +%Y%m%d`
ACTION=$1

#函数-表明脚本用法,不符合用法则直接跳出
function USAGE() {
  echo -e "使用方法:\033[32m ./server.sh start|stop|reload|restart|check\033[0m"
  echo -e "用法示例:\033[32m ./server.sh start\033[0m"
}

function START( ) {
  nohup /root/init_agent_deploy/prometheus-2.37.8/prometheus --config.file=/root/init_agent_deploy/prometheus-2.37.8/prometheus.yml --web.enable-lifecycle --storage.tsdb.path=/root/init_agent_deploy/prometheus-2.37.8/data --storage.tsdb.retention=30d --web.listen-address=0.0.0.0:19090 >> /root/init_agent_deploy/prometheus-2.37.8/prometheus.log 2>&1 &
}
function STOP( ) {
  ps -ef|grep '/root/init_agent_deploy/prometheus-2.37.8/prometheus'|grep -v grep|awk '{print $2}'|xargs kill -9
}
function CHECK( ) {
  /root/init_agent_deploy/prometheus-2.37.8/promtool check config /root/init_agent_deploy/prometheus-2.37.8/prometheus.yml
}
function STATUS( ) {
  ps -ef | grep -v grep | grep --color=auto '/root/init_agent_deploy/prometheus-2.37.8/prometheus'
}

echo "${OUTPUT_DIVISION}"
if [ "$1" == "start" ];then
  START;sleep 2s;STATUS
elif [ "$1" == "stop" ];then
  STOP
elif [ "$1" == "check" ];then
  CHECK
elif [ "$1" == "status" ];then
  STATUS
elif [ "$1" == "reload" ];then
  #echo -e "\033[32mprometheus支持热部署,以下重启只是重新加载配置文件\033[0m";echo "${OUTPUT_DIVISION}"
  curl -X POST http://localhost:19090/-/reload;STATUS
elif [ "$1" == "restart" ];then
  STOP;sleep 3S;START;sleep 3S;STATUS
else
  USAGE
fi
服务路径、监听端口按照实际修改
4、启动服务
shellsh server.sh
5、测试访问
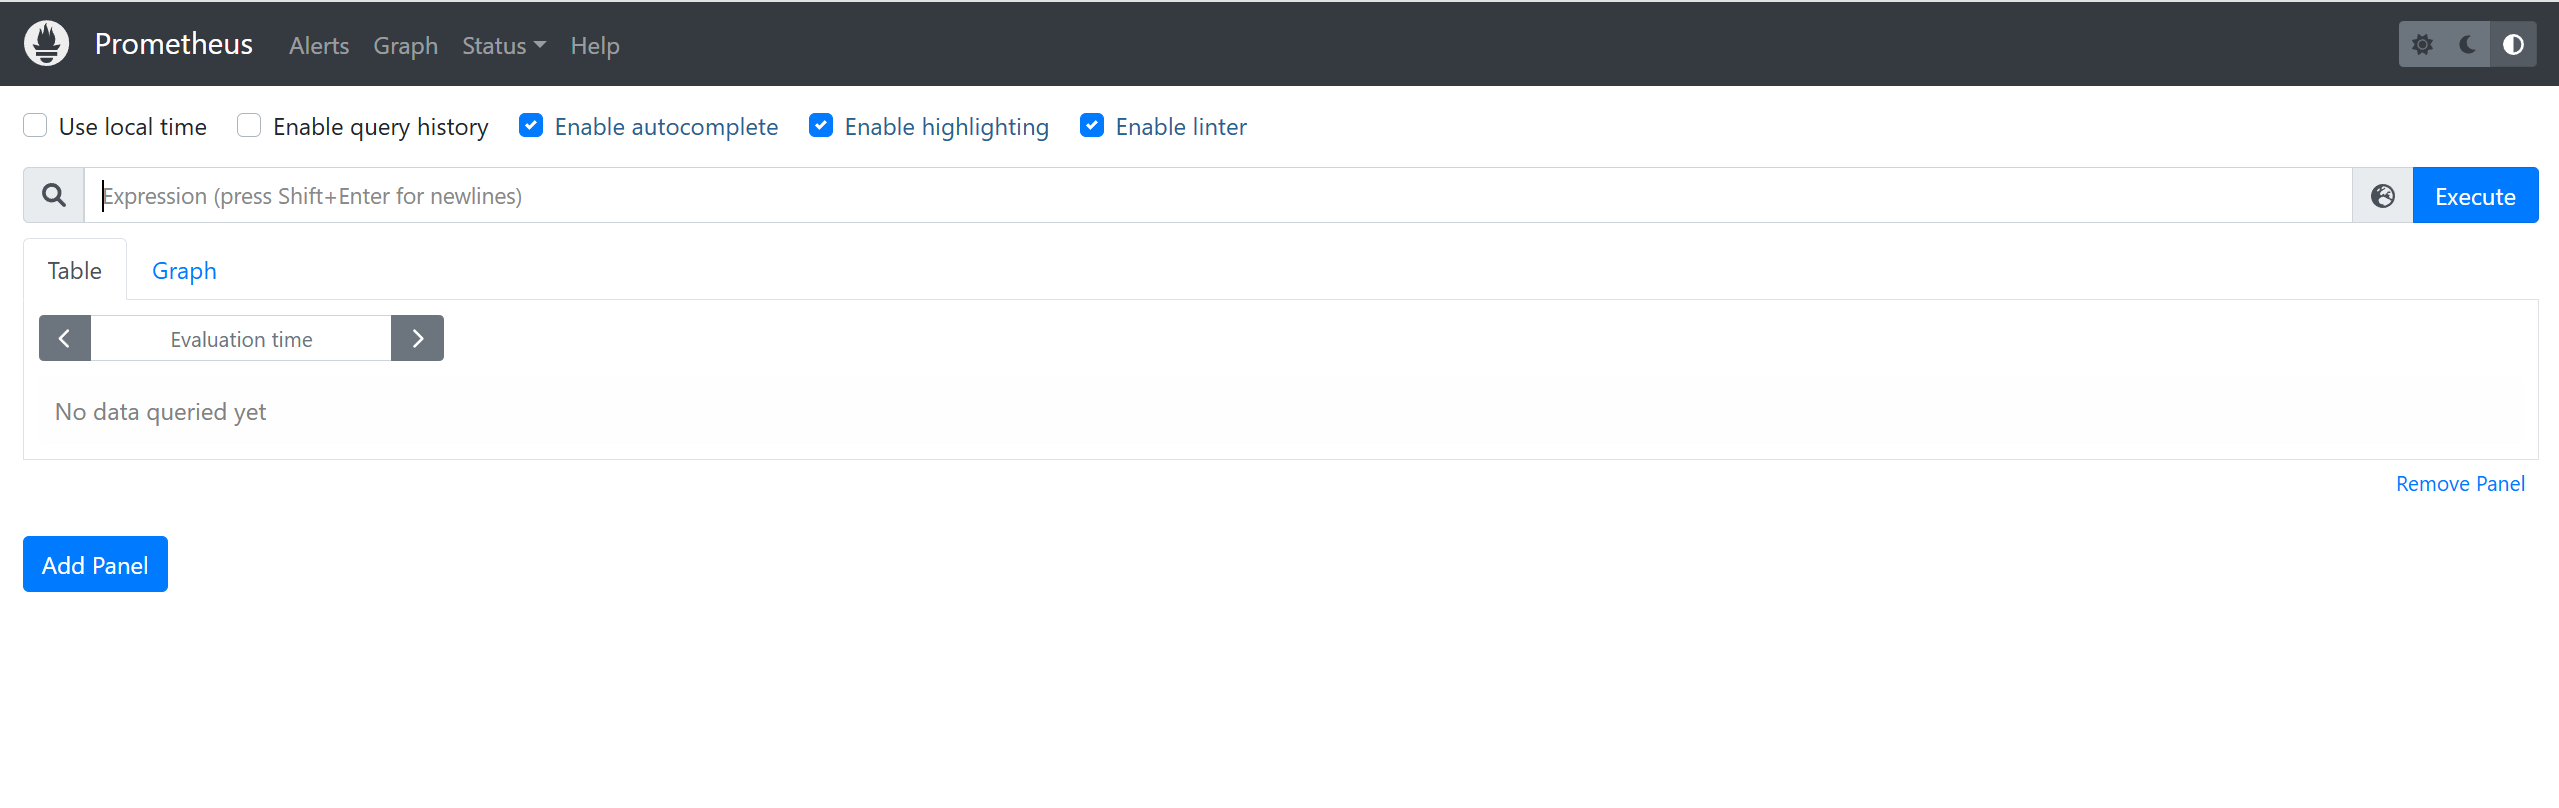
6、PromQL
Prometheus 提供了一种名为 PromQL(Prometheus 查询语言)的功能查询语言,允许用户实时选择和聚合时间序列数据。
向 Prometheus 发送查询请求时,它可以是即时查询(在某个时间点进行评估),也可以是*范围查询(*在开始时间和结束时间之间以等距步骤进行)。PromQL 在每种情况下的工作方式完全相同;范围查询就像在不同时间戳多次运行的即时查询。
更多说明参考官方文档:https://prometheus.io/docs/prometheus/latest/querying/basics/
-
rate():用于计算给定时间区间内指标的平均变化速率,通常用于计算请求速率(QPS)等。
-
irate():与rate()类似,用于计算瞬时变化率,即时间区间内最后两个样本点的差除以时间差,适用于快速变化的计数器。
-
sort() 和 sort_desc():用于对时间序列进行升序或降序排序。
-
delta():用于计算一段时间内的变化值,例如计算过去一小时磁盘空间的变化量。
-
sum():对所有值进行求和,常用于聚合查询。
-
min() 和 max():返回所有记录的最小值和最大值。
-
avg():计算所有记录的平均值。
-
stddev():计算标准差,用于描述数据的波动大小。
-
count():返回所有记录的计数。
-
bottomk() 和 topk():用于对样本值进行排序,返回当前样本值后N位和前N位的时间序列。
-
abs():返回输入向量的所有样本的绝对值。
-
ceil():将所有元素的样本值向上四舍五入到最接近的整数。
-
round():将输入向量的样本值四舍五入到指定的小数位数。
-
quantile_over_time(): 用于计算指定时间区间内值的 φ-quantile 分位数(0 ≤ φ ≤ 1)
shell# 函数使用示例
# CPU核数 count
count(node_cpu_seconds_total{mode="idle"})by(instance)
# CPU使用率 rate+avg
(1 - avg(rate(node_cpu_seconds_total{mode="idle"}[1m])) by (instance)) * 100
# CPU使用率-结果保留两位小数 round
round((1 - avg(rate(node_cpu_seconds_total{mode="idle"}[1m])) by (instance)) * 100, 0.01)
# CPU使用率top5 topk
round(topk(5, (1 - avg by (instance) (irate(node_cpu_seconds_total{mode="idle"}[5m])))) * 100, 0.01)
# CPU使用率top5-降序排序后 sort_desc()
sort_desc(round(topk(5, (1 - avg by (instance) (irate(node_cpu_seconds_total{mode="idle"}[5m])))) * 100, 0.01))
# 计算CPU使用率P99 quantile_over_time
quantile_over_time(0.99, (1 - avg(rate(node_cpu_seconds_total{mode="idle"}[1m])) by (instance)) [7d:1h]) * 100
3、Grafana部署
-
下载
Grafana 是一个开源的可视化工具,支持多种数据源,能够创建动态仪表板,帮助用户更好地理解和分析数据。Grafana 提供了丰富的图表类型和自定义选项,用户可以根据需要灵活配置仪表板。
shellwget https://dl.grafana.com/oss/release/grafana-9.5.0.linux-amd64.tar.gz -
解压、配置
shell# 解压
tar -xvzf grafana-9.5.0.linux-amd64.tar.gz
# 重命名
mv grafana-9.5.0.linux-amd64 grafana-9.5.0
# 复制启动配置文件
cd grafana-9.5.0/conf && cp defaults.ini grafana.ini
Grafana默认使用3000端口,可以根据需要自定义修改grafana.ini:http_port = 3000
-
创建服务启停文件
cd ..
vi
server.shshell#!/bin/bash OUTPUT_DIVISION='--------------------------------------------------' TODAY=`date +%Y%m%d` ACTION=$1 #函数-表明脚本用法,不符合用法则直接跳出 function USAGE() { echo -e "使用方法:\033[32m ./server.sh start|stop|reload|restart|check\033[0m" echo -e "用法示例:\033[32m ./server.sh start\033[0m" } function START( ) { nohup grafanaDir/bin/grafana-server --config grafanaDir/conf/grafana.ini >> grafanaDir/grafana.log 2>&1 & } function STOP( ) { ps -ef|grep 'grafana'|grep -v grep|awk '{print $2}'|xargs kill -9 } function STATUS( ) { ps -ef | grep -v grep | grep --color=auto 'grafana' } echo "${OUTPUT_DIVISION}" if [ "$1" == "start" ];then START;sleep 2s;STATUS elif [ "$1" == "stop" ];then STOP elif [ "$1" == "status" ];then STATUS elif [ "$1" == "restart" ];then STOP;sleep 3S;START;sleep 3S;STATUS else USAGE fi -
启动服务
shellsh server.sh start -
测试访问
默认情况第一次登陆进去,默认用户名密码都是admin,但是会强制提示更新密码,直接更新密码即可。

-
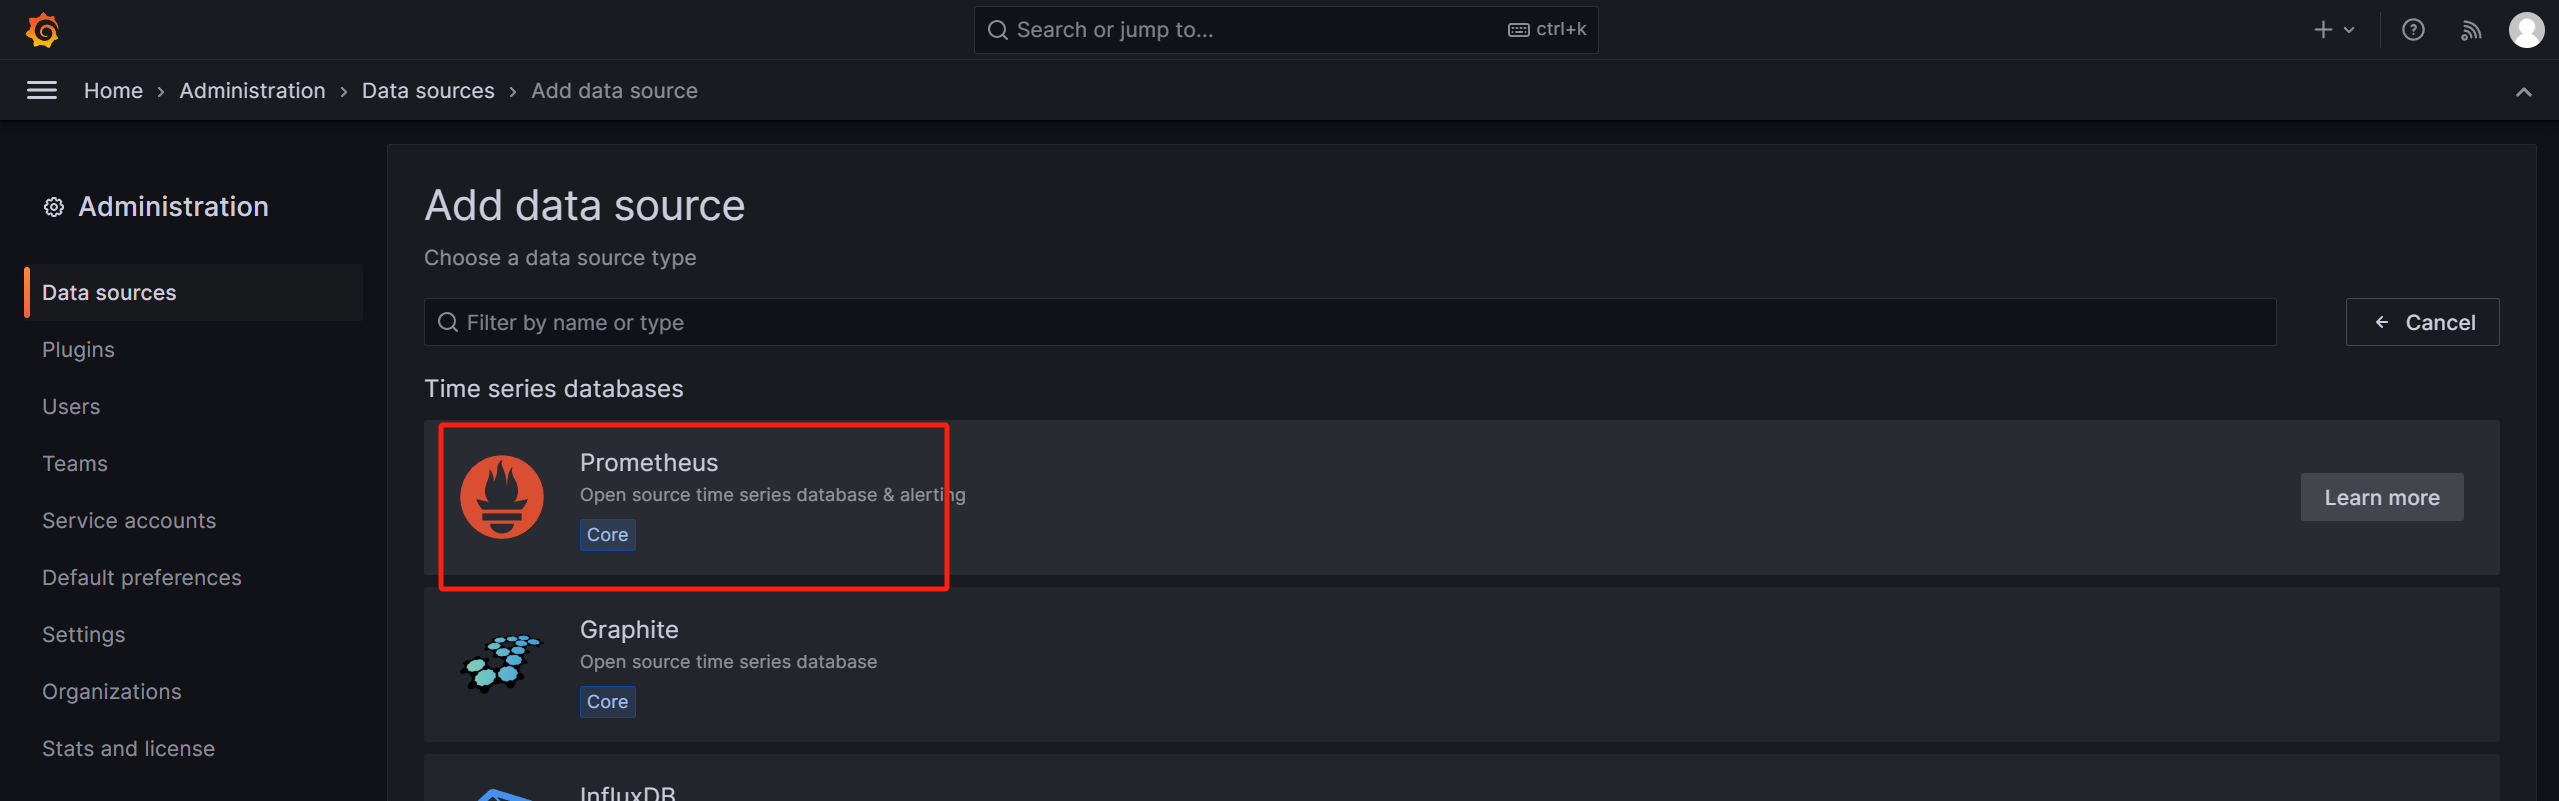
配置数据源
1、登录Grafana后,导航到 “Configuration” -> “Data Sources”。
2、添加一个新的数据源,选择 Prometheus,并设置 URL 为Prometheus的地址:
http://127.0.0.1:19090。
4、主机监控(ndoe_exporter)
4.1 node_exporter安装
监控的主机都需要安装
-
下载:
node_exporter小于1.6.0版本已知会存在问题,尽量使用更高版本
shellwget https://github.com/prometheus/node_exporter/releases/download/v1.8.2/node_exporter-1.8.2.linux-amd64.tar.gz -
解压:
shelltar xf node_exporter-1.8.2.linux-amd64.tar.gz -
重命名:
shellmv node_exporter-1.8.2.linux-amd64 node_exporter-1.8.2 -
创建自定义采集指标文件目录(可选):
shellcd node_exporter-1.8.2/ mkdir textfile.collected -
自定义脚本实现自定义指标(可选-和第4步联动)
-
参考目标:实现自定义采集主机filebeat进程状态
-
实现步骤:
-
通过命令判断主机filebeat进程状态
shellps -ef | grep filebeat11 | grep -v grep > /dev/null && echo 'ok' || echo "no" -
通过命令返回结果判断filebeat进程状态并自定义指标写入textfile.collected目录
shellcd textfile.collected
echo 'filebeat_up{addr="192.168.0.103"} 0' > custom_filebeat_metrics.prom
相关解释:
filebeat_up:自定义指标名称
addr=“192.168.0.103”:自定义标签名称及标签值
0:自定义指标值
-
通过Prometheus提供的页面输入``filebeat_up`查询到自定义指标数据
-
-
真实线上使用参考:使用crontab执行脚本定时更新
custom_filebeat_metrics.prom文件中的值,保证获取到的指标的时效性
-
-
启动:
-
编写服务启停脚本
shellvi server.sh脚本内容:
shell#!/bin/bash
OUTPUT_DIVISION='--------------------------------------------------'
TODAY=`date +%Y%m%d`
ACTION=$1

#函数-表明脚本用法,不符合用法则直接跳出
USAGE() {
  echo -e "使用方法:\033[32m ./server.sh start|stop|restart|status\033[0m"
  echo -e "用法示例:\033[32m ./server.sh start\033[0m"
}

function START( ) {
nohup NODE_EXPORTER_DIR/node_exporter --web.listen-address=:19100 --collector.systemd --collector.textfile --collector.textfile.directory=NODE_EXPORTER_DIR/textfile.collected >> NODE_EXPORTER_DIR/node_exporter.log 2>&1 &
}
function STOP( ) {
kill $(ps aux | grep -v grep | grep 'NODE_EXPORTER_DIR/node_exporter' | tr -s ' ' | cut -d ' ' -f 2)
}
function STATUS( ) {
ps aux | grep -v grep | grep --color=auto 'NODE_EXPORTER_DIR/node_exporter'
}

echo "${OUTPUT_DIVISION}"
if [ "$1" == "start" ];then
  START;sleep 2s;STATUS
elif [ "$1" == "stop" ];then
  STOP
elif [ "$1" == "status" ];then
  STATUS
elif [ "$1" == "restart" ];then
  STOP;sleep 3s;START;sleep 3s;STATUS
else
  USAGE
fi
其中NODE_EXPORTER_DIR、--web.listen-address=:19100根据实际修改
-
启动服务
shellsh server.sh start -
4.2 prometheus配置
-
修改Prometheus配置文件:
shellvi prometheus.yml在配置文件最后增加下面的配置,路径根据实际调整
shell- job_name: "node_exporter" file_sd_configs: - files: - "targets/node_exporter.yml" refresh_interval: 5s注:以上方式可以实现动态添加主机(无需每次添加都要重启prometheus服务)
-
创建node_exporter.yml文件:
shell# 若在Prometheus文件夹不存在targets目录则先创建
mkdir targets
# 创建编辑文件
cd targets && vi node_exporter.yml
在node_exporter.yml配置文件填写下面的配置,地址按照实际填写即可
shell- targets: ['192.168.3.218:19100']
  labels:
    addr: 192.168.3.218
其中targets中的ip
是node_exporter部署的实例地址addr属于自定义标签(此处是主机的ip),根据业务需要可以增加更多的自定义标签
-
重启Prometheus服务:
shellsh server.sh restart
4.3 graran配置
创建仪表盘:Import dashboard
导入ID:1860 或者下载json文件导入
4.4 常用指标
-
node_exporter状态
sqlup{job="node_exporter"} -
主机运行时间(天)
sqlsum(time() - node_boot_time_seconds)by(instance)/86400 -
内存相关
sql# 总内存(GB) (node_memory_MemTotal_bytes)/1024/1024/1024 # 已使用内存(GB) (node_memory_Buffers_bytes + node_memory_MemFree_bytes + node_memory_Cached_bytes) # 可用内存(GB) (node_memory_MemTotal_bytes) - (node_memory_Buffers_bytes + node_memory_MemFree_bytes + node_memory_Cached_bytes) # 内存使用率(free+cache+buffer)/count (1 - (node_memory_Buffers_bytes + node_memory_MemFree_bytes + node_memory_Cached_bytes)/node_memory_MemTotal_bytes) * 100 -
CPU相关
sql# CPU核数 count(node_cpu_seconds_total{mode="idle"})by(instance) # CPU总使用率 (1 - avg(rate(node_cpu_seconds_total{mode="idle"}[5m])) by (instance)) * 100 # 系统使用率 avg(rate(node_cpu_seconds_total{mode="system"}[5m])) by (instance) *100 # 用户使用率 avg(rate(node_cpu_seconds_total{mode="user"}[5m])) by (instance) *100 # io_wait avg(rate(node_cpu_seconds_total{mode="iowait"}[5m])) by (instance) *100 -
磁盘相关
sql# 磁盘使用率 (node_filesystem_size_bytes{fstype=~"ext.*|xfs|nfs",mountpoint !~".*pod.*"}-node_filesystem_free_bytes{fstype=~"ext.*|xfs|nfs",mountpoint !~".*pod.*"}) *100/(node_filesystem_avail_bytes {fstype=~"ext.*|xfs|nfs",mountpoint !~".*pod.*"}+(node_filesystem_size_bytes{fstype=~"ext.*|xfs|nfs",mountpoint !~".*pod.*"}-node_filesystem_free_bytes{fstype=~"ext.*|xfs|nfs",mountpoint !~".*pod.*"})) # 磁盘读取速率 kb/s sum(rate(node_disk_read_bytes_total{job="node_exporter"}[5m]))by(instance) / 1024 # 磁盘写入速率 kb/s sum(rate(node_disk_written_bytes_total{job="node_exporter"}[5m]))by(instance) /1024 -
负载
sql# 1分钟负载 node_load1 # 5分钟负载 node_load5 # 15分钟负载 node_load15 -
IOUtil使用率
sqlmax(rate(node_disk_io_time_seconds_total[5m])) by (instance) *100 -
分区使用率
SQLmax((node_filesystem_size_bytes{fstype=~"ext.?|xfs"}-node_filesystem_free_bytes{fstype=~"ext.?|xfs"}) *100/(node_filesystem_avail_bytes {fstype=~"ext.?|xfs"}+(node_filesystem_size_bytes{fstype=~"ext.?|xfs"}-node_filesystem_free_bytes{fstype=~"ext.?|xfs"})))by(instance) -
网络相关
sql# 连接数 node_netstat_Tcp_CurrEstab # 下载带宽 kb/s max(rate(node_network_receive_bytes_total[5m])*8) by (instance) / 1024 # 上传带宽 kb/s max(rate(node_network_transmit_bytes_total[5m])*8) by (instance) / 1024 # tcp time wait node_sockstat_TCP_tw -
健康值
node_memory_MemAvailable_bytes指标在某些较老的机器上可能不存在,可以通过(free+cache+buffer)的方式替换
sql((1-(1 - avg(irate(node_cpu_seconds_total{mode="idle"}[5m])) by (addr))^1.3)^(1/3)*0.5 + (1-(1 - avg(node_memory_MemAvailable_bytes / node_memory_MemTotal_bytes)by (addr))^6)^(1/3)*0.3 + (1 - max(irate(node_disk_io_time_seconds_total[5m]))by (addr)^1.1)^(1/2)*0.2)*100 -
CPU使用率P99
sqlquantile_over_time(0.99, (1 - avg(rate(node_cpu_seconds_total{mode="idle"}[1m])) by (addr)) [7d:1h]) * 100 -
内存使用率P99
node_memory_MemAvailable_bytes指标在某些较老的机器上可能不存在,可以通过(free+cache+buffer)的方式替换
sqlquantile_over_time(0.99, (1 - node_memory_MemAvailable_bytes / node_memory_MemTotal_bytes)[7d:1h]) * 100
5、 Redis监控(redis_exporter)
5.1 redis_exporter安装
redis集群中每个节点都需要安装,也可以以同一个exporter但不同的配置文件来启动管理多个exporter实例
-
下载:
shellwget https://github.com/oliver006/redis_exporter/releases/download/v1.50.0/redis_exporter-v1.50.0.linux-amd64.tar.gz -
解压:
shelltar xf redis_exporter-v1.50.0.linux-amd64.tar.gz -
重命名:
shellmv redis_exporter-v1.50.0.linux-amd64 redis_exporter-v1.50.0 -
创建Redis认证文件(可选):
shellcd redis_exporter-v1.50.0/
vim .redis-conf-9000.json
.redis-conf-9000.json
shell{ "redis://localhost:9000": "123456" #每台主机写自己的地址 } -
启动:
-
编写服务启停脚本
shellvi server.sh脚本内容:
shell#!/bin/bash
OUTPUT_DIVISION='--------------------------------------------------'
TODAY=`date +%Y%m%d`
ACTION=$1

#函数-表明脚本用法,不符合用法则直接跳出
USAGE() {
  echo -e "使用方法:\033[32m ./server.sh start|stop|restart|status\033[0m"
  echo -e "用法示例:\033[32m ./server.sh start\033[0m"
}

function START( ) {
nohup redis_exporter_DIR/redis_exporter --redis.addr=127.0.0.1:6379 --redis.password-file=redis_exporter_DIR/.redis-conf.json --web.listen-address=:19121 >> redis_exporter_DIR/exporter.log 2>&1 &
}
function STOP( ) {
kill $(ps aux | grep -v grep | grep 'redis_exporter_DIR/redis_exporter' | tr -s ' ' | cut -d ' ' -f 2)
}
function STATUS( ) {
ps aux | grep -v grep | grep --color=auto 'redis_exporter_DIR/redis_exporter'
}

echo "${OUTPUT_DIVISION}"
if [ "$1" == "start" ];then
  START;sleep 3s;STATUS
elif [ "$1" == "stop" ];then
  STOP
elif [ "$1" == "status" ];then
  STATUS
elif [ "$1" == "restart" ];then
  STOP;sleep 5s;START;sleep 3s;STATUS
else
  USAGE
fi
其中redis_exporter_DIR、--redis.addr=127.0.0.1:6379根据实际修改
如果redis无需认证,则不需要创建Redis认证文件,启停文件也不需要该行配置:
--redis.password-file=redis_exporter_DIR/.redis-conf.json
-
启动服务
shellsh server.sh start -
5.2 prometheus配置
-
修改Prometheus配置文件:
shellvi prometheus.yml在配置文件最后增加下面的配置,路径根据实际调整
shell- job_name: "redis_exporter" file_sd_configs: - files: - "targets/redis_exporter.yml" refresh_interval: 5s注:以上方式可以实现动态添加主机(无需每次添加都要重启prometheus服务)
-
创建redis_exporter.yml文件:
shell# 若在Prometheus文件夹不存在targets目录则先创建
mkdir targets
# 创建编辑文件
cd targets && vi redis_exporter.yml
在redis_exporter.yml配置文件填写下面的配置,地址按照实际填写即可
shell- targets: ['192.168.3.218:19121']
  labels:
    addr: 192.168.3.218:7000
其中targets中的ip
是redis_exporter部署的实例地址addr属于自定义标签(此处是redis节点实例的地址),根据业务需要可以增加更多的自定义标签
-
重启Prometheus服务:
shellsh server.sh restart
5.3 graran配置
创建仪表盘:Import dashboard
导入ID:18345 或者下载json文件导入
5.4 常用指标
-
节点状态
sqlredis_up -
内存使用率
sql100 * (redis_memory_used_bytes / (redis_config_maxmemory+0.1) ) -
节点配置内存
sqlredis_config_maxmemory -
内存高峰值(单位MB)
sqlredis_memory_used_peak_bytes / 1024 / 1024 -
客户端连接数
label值根据自定义填写
sqlredis_connected_clients -
近两分钟执行命令数
sqlrate(redis_commands_processed_total[2m]) -
节点使用内存(单位MB)
sqlredis_memory_used_bytes / 1024 / 1024 -
网络IO
写入
sqlrate(redis_net_input_bytes_total[5m])读取
rate(redis_net_output_bytes_total[5m]) -
基本信息
sqlredis_instance_info -
key总数
sqlsum(redis_db_keys)by(addr,appId,appName,instance) -
fork子进程耗时(单位ms)
sqlredis_latest_fork_usec -
24小时未执行rdb
sql(time() - redis_rdb_last_save_timestamp_seconds) > 86400
6、 MySQL监控(mysqld_exporter)
6.1 mysqld_exporter安装
mysql集群中每个节点都需要安装,也可以以同一个exporter但不同的配置文件来启动管理多个exporter实例
mysqld_exporter要求MySQL > 5.6
-
下载:
shellwget https://github.com/prometheus/mysqld_exporter/releases/download/v0.16.0/mysqld_exporter-0.16.0.linux-amd64.tar.gz -
解压:
shelltar xf mysqld_exporter-0.16.0.linux-amd64.tar.gz -
重命名:
shellmv mysqld_exporter-0.16.0.linux-amd64 mysql_exporter-v0.16.0 -
创建MySQL认证文件:
shellcd mysql_exporter-v0.16.0/
vim .my.cnf
.my.cnf
按实填写mysql信息,填写密码时——避免密码出现特殊字符,需要使用``包裹起来
shell[client] user=root password=`123456` host=localhost port=13306 -
启动:
-
编写服务启停脚本
shellvi server.sh脚本内容:
shell#!/bin/bash
OUTPUT_DIVISION='--------------------------------------------------'
TODAY=`date +%Y%m%d`
ACTION=$1

#函数-表明脚本用法,不符合用法则直接跳出
USAGE() {
  echo -e "使用方法:\033[32m ./server.sh start|stop|restart|status\033[0m"
  echo -e "用法示例:\033[32m ./server.sh start\033[0m"
}

function START( ) {
nohup mysql_exporter_DIR/mysqld_exporter --config.my-cnf=mysql_exporter_DIR/.my.cnf --web.listen-address=:19104 >> mysql_exporter_DIR/exporter.log 2>&1 &
}
function STOP( ) {
kill $(ps aux | grep -v grep | grep 'mysql_exporter_DIR/mysqld_exporter' | tr -s ' ' | cut -d ' ' -f 2)
}
function STATUS( ) {
ps aux | grep -v grep | grep --color=auto 'mysql_exporter_DIR/mysqld_exporter'
}

echo "${OUTPUT_DIVISION}"
if [ "$1" == "start" ];then
  START;sleep 3s;STATUS
elif [ "$1" == "stop" ];then
  STOP
elif [ "$1" == "status" ];then
  STATUS
elif [ "$1" == "restart" ];then
  STOP;sleep 5s;START;sleep 3s;STATUS
else
  USAGE
fi
其中mysql_exporter_DIR根据实际修改为全路径
-
启动服务
shellsh server.sh start -
6.2 prometheus配置
-
修改Prometheus配置文件:
shellvi prometheus.yml在配置文件最后增加下面的配置,路径根据实际调整
shell- job_name: "mysql_exporter" file_sd_configs: - files: - "targets/mysql_exporter.yml" refresh_interval: 5s注:以上方式可以实现动态添加主机(无需每次添加都要重启prometheus服务)
-
创建mysql_exporter.yml文件:
shell# 若在Prometheus文件夹不存在targets目录则先创建
mkdir targets
# 创建编辑文件
cd targets && vi mysql_exporter.yml
在mysql_exporter.yml配置文件填写下面的配置,地址按照实际填写即可
shell- targets: ['192.168.3.218:19104']
  labels:
    addr: 192.168.3.218:13306
其中targets中的ip
是mysql_exporter部署的实例地址addr属于自定义标签(此处是mysql节点实例的地址),根据业务需要可以增加更多的自定义标签
-
重启Prometheus服务:
shellsh server.sh restart
6.3 graran配置
创建仪表盘:Import dashboard
导入ID:7362 或者下载json文件导入
6.4 常用指标
-
节点状态
sqlmysql_up -
当前连接数
sqlmysql_global_status_threads_connected -
活跃连接数
sqlmysql_global_status_threads_running -
TPS
sqlsum(rate(mysql_global_status_commands_total{command=~"commit|rollback"}[1m]))by (instance) -
QPS
sqlrate(mysql_global_status_queries[1m]) -
复制延迟
sqlmysql_slave_status_seconds_behind_master -
双写页数量
sqlrate(mysql_global_status_innodb_dblwr_pages_written[1m]) -
其他指标
sqlmysql_global_status_aborted_clients 中止的客户端连接数
mysql_global_status_aborted_connects 中止的连接数
mysql_global_status_connections 总连接数
mysql_global_status_created_tmp_disk_tables 创建的临时磁盘表数量
mysql_global_status_created_tmp_tables 创建的临时表数量
mysql_global_status_handler_delete 执行删除操作的次数
mysql_global_status_handler_read_first 执行读取第一个记录的次数
mysql_global_status_handler_read_key 按键读取的次数
mysql_global_status_handler_read_next 执行读取下一个记录的次数
mysql_global_status_handler_read_prev 执行读取上一个记录的次数
mysql_global_status_handler_read_rnd 随机读取的次数
mysql_global_status_handler_read_rnd_next 随机读取下一个记录的次数
mysql_global_status_handler_update 执行更新操作的次数
mysql_global_status_key_reads 从键缓存中读取的次数
mysql_global_status_key_writes 写入键缓存的次数
mysql_global_status_max_connections 最大连接数
mysql_global_status_open_tables 当前打开的表数量
mysql_global_status_opened_tables 打开的表总数
mysql_global_status_queries 执行的查询总数
mysql_global_status_select_full_join 完全连接的查询次数
mysql_global_status_select_full_range_join 完全范围连接的查询次数
mysql_global_status_select_range 范围查询的次数
mysql_global_status_select_range_check 范围检查查询的次数
mysql_global_status_select_scan 扫描查询的次数
mysql_global_status_slow_queries 慢查询的总数
mysql_global_status_table_locks_waited 表锁等待次数
mysql_global_status_threads_connected 当前连接的线程数
mysql_global_status_threads_running 当前运行的线程数
mysql_global_status_uptime 数据库运行时间(秒)
mysql_global_status_innodb_buffer_pool_sizeInnoDB 缓冲池大小
mysql_global_status_innodb_buffer_pool_pages_totalInnoDB 缓冲池总页数
mysql_global_status_innodb_buffer_pool_pages_freeInnoDB 缓冲池空闲页数
mysql_global_status_innodb_buffer_pool_pages_dirtyInnoDB 缓冲池脏页数
mysql_global_status_innodb_buffer_pool_readsInnoDB 缓冲池读取次数
mysql_global_status_innodb_buffer_pool_read_aheadInnoDB 缓冲池预读取次数
mysql_global_status_innodb_buffer_pool_read_ahead_evicted 被驱逐的预读取页数
mysql_global_status_innodb_buffer_pool_wait_free 等待空闲页的次数
mysql_global_status_innodb_rows_read 读取的 InnoDB 行数
mysql_global_status_innodb_rows_inserted 插入的 InnoDB 行数
mysql_global_status_innodb_rows_updated 更新的 InnoDB 行数
mysql_global_status_innodb_rows_deleted 删除的 InnoDB 行数
mysql_global_status_innodb_transactionsInnoDB 事务总数
mysql_global_status_innodb_lock_waitsInnoDB 锁等待次数
mysql_global_status_innodb_deadlocksInnoDB 死锁次数
mysql_global_status_innodb_log_waitsInnoDB 日志等待次数
mysql_global_status_innodb_log_write_requestsInnoDB 日志写入请求次数
mysql_global_status_innodb_log_writesInnoDB 日志写入次数
mysql_global_status_innodb_log_flushesInnoDB 日志刷新次数
mysql_global_status_innodb_log_flushes_avg_timeInnoDB 日志刷新平均时间
mysql_global_status_innodb_log_flushes_max_timeInnoDB 日志刷新最大时间
6、 Tomcat 监控(jmx_exporter)
6.1 jmx_exporter 安装
Tomcat 集群中每个节点都需要安装
项目开源地址:https://github.com/prometheus/jmx_exporter
-
下载:
shell
#1、下载jmx_exporter的jar包
wget https://repo1.maven.org/maven2/io/prometheus/jmx/jmx_prometheus_javaagent/0.19.0/jmx_prometheus_javaagent-0.19.0.jar
#2、下载监控tomcat的配置文件--配置文件地址:https://github.com/prometheus/jmx_exporter/blob/main/examples/tomcat.yml
2. 修改 Tomcat 配置文件并重新启动:

```shell
#1、停止Tomcat服务
sh shutdown.sh
#2、修改配置文件
-
重命名:
shellmv mysqld_exporter-0.16.0.linux-amd64 mysql_exporter-v0.16.0 -
创建 MySQL 认证文件:
shellcd mysql_exporter-v0.16.0/
vim .my.cnf
.my. Cnf
按实填写 mysql 信息,填写密码时——避免密码出现特殊字符,需要使用``包裹起来
shell[client] user=root password=`123456` host=localhost port=13306 -
启动:
-
编写服务启停脚本
shellvi server.sh脚本内容:
shell#!/bin/bash
OUTPUT_DIVISION='--------------------------------------------------'
TODAY=`date +%Y%m%d`
ACTION=$1

#函数-表明脚本用法,不符合用法则直接跳出
USAGE() {
  echo -e "使用方法:\033[32m ./server.sh start|stop|restart|status\033[0m"
  echo -e "用法示例:\033[32m ./server.sh start\033[0m"
}

function START( ) {
nohup mysql_exporter_DIR/mysqld_exporter --config.my-cnf=mysql_exporter_DIR/.my.cnf --web.listen-address=:19104 >> mysql_exporter_DIR/exporter.log 2>&1 &
}
function STOP( ) {
kill $(ps aux | grep -v grep | grep 'mysql_exporter_DIR/mysqld_exporter' | tr -s ' ' | cut -d ' ' -f 2)
}
function STATUS( ) {
ps aux | grep -v grep | grep --color=auto 'mysql_exporter_DIR/mysqld_exporter'
}

echo "${OUTPUT_DIVISION}"
if [ "$1" == "start" ];then
  START;sleep 3s;STATUS
elif [ "$1" == "stop" ];then
  STOP
elif [ "$1" == "status" ];then
  STATUS
elif [ "$1" == "restart" ];then
  STOP;sleep 5s;START;sleep 3s;STATUS
else
  USAGE
fi
其中 mysql_exporter_DIR 根据实际修改为全路径
-
启动服务
shellsh server.sh start -
6.2 prometheus 配置
-
修改 Prometheus 配置文件:
shellvi prometheus.yml在配置文件最后增加下面的配置,路径根据实际调整
shell- job_name: "mysql_exporter" file_sd_configs: - files: - "targets/mysql_exporter.yml" refresh_interval: 5s注:以上方式可以实现动态添加主机(无需每次添加都要重启 prometheus 服务)
-
创建 mysql_exporter. Yml 文件:
shell# 若在Prometheus文件夹不存在targets目录则先创建
mkdir targets
# 创建编辑文件
cd targets && vi mysql_exporter.yml
在 mysql_exporter. Yml 配置文件填写下面的配置,地址按照实际填写即可
shell- targets: ['192.168.3.218:19104']
  labels:
    addr: 192.168.3.218:13306
其中 targets 中的 ip: port 是 mysql_exporter 部署的实例地址
addr 属于自定义标签(此处是 mysql 节点实例的地址),根据业务需要可以增加更多的自定义标签
-
重启 Prometheus 服务:
shellsh server.sh restart
6.3 graran 配置
创建仪表盘:Import dashboard
导入 ID: 8704 或者下载 json 文件导入
6.4 常用指标
-
节点状态
sqlmysql_up -
当前连接数
sqlmysql_global_status_threads_connected -
活跃连接数
sqlmysql_global_status_threads_running -
TPS
sqlsum(rate(mysql_global_status_commands_total{command=~"commit|rollback"}[1m]))by (instance) -
QPS
sqlrate(mysql_global_status_queries[1m]) -
复制延迟
sqlmysql_slave_status_seconds_behind_master -
双写页数量
sqlrate(mysql_global_status_innodb_dblwr_pages_written[1m])
7、SpringBoot项目监控
项目集成
jmx_exporter集成
进阶:VictoriaMetrics使用
1、简介
VictoriaMetrics 是一款快速、经济高效且可扩展的监控解决方案和时间序列数据库,更多说明参考官方文档。
2、安装
面对获取速率低于每秒一百万个数据点的场景下,官方建议使用单节点版本而不是群集版本。单节点版本可以根据 CPU 内核、RAM 和可用存储空间的数量完美扩展。与群集版本相比,单节点版本更易于配置和操作。
VictoriaMetrics 的分布形式如下:
- 单服务器-VictoriaMetrics - 一体化二进制文件,非常易于使用和维护。单服务器-VictoriaMetrics 可完美垂直扩展,轻松处理每秒数百万个指标;
- VictoriaMetrics Cluster - 用于构建水平可扩展集群的组件集。
- VictoriaMetrics Cloud - 允许用户运行托管在 AWS 上的 VictoriaMetrics,而无需执行典型的 DevOps 任务,例如正确的配置、监控、日志收集、访问保护、软件更新、备份等。
从二进制文件启动 VictoriaMetrics 单节点
- 从GitHub下载适合您的操作系统和架构的正确二进制文件。
- 通过运行以下命令将档案提取到 /usr/local/bin:
shsudo tar -xvf <victoriametrics-archive> -C /usr/local/bin
将其替换<victoriametrics-archive>为您在步骤 1 中下载的档案的路径。
- 在系统上创建 VictoriaMetrics 用户:
shsudo useradd -s /usr/sbin/nologin victoriametrics
- 创建一个用于存储 VictoriaMetrics 数据的文件夹:
shmkdir -p /var/lib/victoria-metrics && chown -R victoriametrics:victoriametrics /var/lib/victoria-metrics
- 通过运行以下命令创建 Linux 服务:
shcat <<END >/etc/systemd/system/victoriametrics.service
[Unit]
Description=VictoriaMetrics service
After=network.target

[Service]
Type=simple
User=victoriametrics
Group=victoriametrics
ExecStart=/usr/local/bin/victoria-metrics-prod -storageDataPath=/var/lib/victoria-metrics -retentionPeriod=90d -selfScrapeInterval=10s
SyslogIdentifier=victoriametrics
Restart=always

PrivateTmp=yes
ProtectHome=yes
NoNewPrivileges=yes

ProtectSystem=full

[Install]
WantedBy=multi-user.target
END
可以将额外的命令行标志添加到ExecStart行中。
请注意,
victoriametrics服务正在监听:8428HTTP 连接(参见-httpListenAddr标志)。
- 通过运行以下命令启动并启用该服务:
shsudo systemctl daemon-reload && sudo systemctl enable --now victoriametrics.service
- 检查服务是否启动成功:
shsudo systemctl status victoriametrics.service
- 在 VictoriaMetrics 处于
Running状态后,请访问 验证vmui是否正常工作http://<ip_or_hostname>:8428/vmui。
3、配置
4、metricsql
VictoriaMetrics实现了 MetricsQL - 受PromQL启发的查询语言。MetricsQL 与 PromQL 向后兼容,因此从 Prometheus 切换到 VictoriaMetrics 后,由 Prometheus 数据源支持的 Grafana 仪表板可以正常工作。参考地址:https://docs.victoriametrics.com/keyconcepts/#metricsql
常见问题
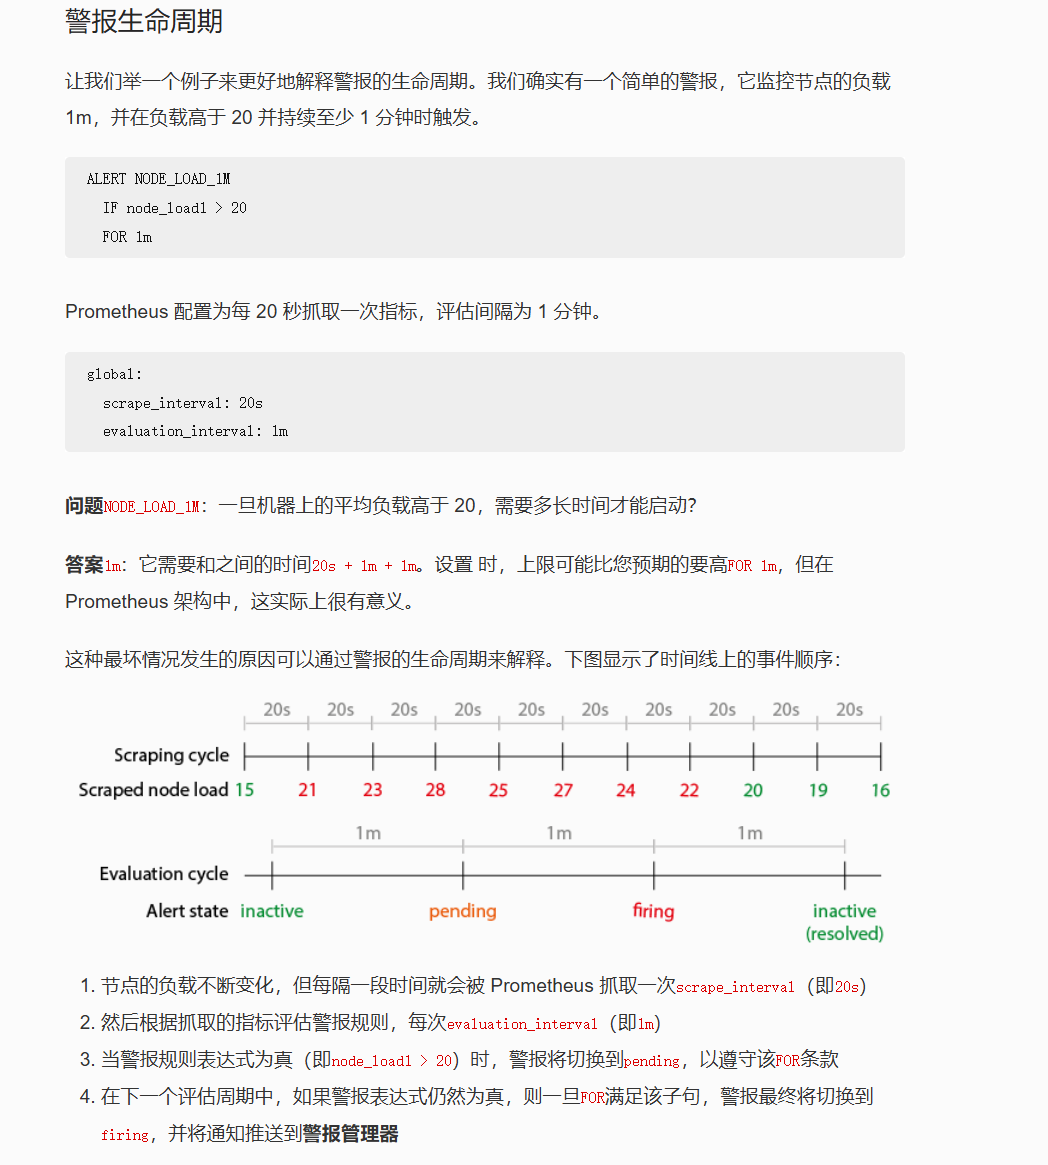
1、Prometheus告警延迟
参考博客:https://pracucci.com/prometheus-understanding-the-delays-on-alerting.html
如果通知触发时间过长,请检查以下延迟:
scrape_interval = 20s(prometheus.yml)evaluation_interval = 20s(prometheus.yml)increase(mysql_global_status_slow_queries[1m]) > 0(alerts/example-mysql.yml)for: 5m(alerts/example-mysql.yml)group_wait = 10s(alertmanager.yml)
2、label标签查询问题(正则表达匹配)
- 如果需要同一个label查询多个实例:
- 错误写法:up{instance="192.168.0.1:19100|192.168.0.2:19100"}
- 正确写法:up{instance=~"192.168.0.1:19100|192.168.0.2:19100"}
3、Prometheus增加基本身份认证
Prometheus 支持与 Prometheus表达式浏览器和HTTP API 的连接的基本身份验证(又名“基本身份验证”)。
**注意:**本教程涵盖与Prometheus 实例的基本身份验证连接。Prometheus实例与抓取目标之间的连接也支持基本身份验证。
哈希密码
假设您希望要求所有访问 Prometheus 实例的用户输入用户名和密码。在本例中,使用admin用户名并选择您想要的任何密码。
首先,生成密码的bcrypt哈希值。要生成哈希密码,我们将使用 python3-bcrypt。
让我们通过运行 来安装它apt install python3-bcrypt,假设您正在运行类似 debian 的发行版。还有其他替代方法来生成散列密码;为了进行测试,您还可以使用网络上的 bcrypt 生成器。
下面是一个使用 python3-bcrypt 提示输入密码并对其进行哈希处理的 Python 脚本:
pythonimport getpass
import bcrypt

password = getpass.getpass("password: ")
hashed_password = bcrypt.hashpw(password.encode("utf-8"), bcrypt.gensalt())
print(hashed_password.decode())
将该脚本保存为gen-pass.py并运行:
python$ python3 gen-pass.py
这将提示您输入密码:
shellpassword:
$2b$12$hNf2lSsxfm0.i4a.1kVpSOVyBCfIB51VRjgBUyv6kdnyTlgWj81Ay
在这个例子中,我使用“test”作为密码。
将该密码保存在某处,我们将在接下来的步骤中使用它!
创建 web.yml
让我们创建一个 web.yml 文件(文档),其内容如下:
shellbasic_auth_users:
    admin: $2b$12$hNf2lSsxfm0.i4a.1kVpSOVyBCfIB51VRjgBUyv6kdnyTlgWj81Ay
您可以使用以下方式验证该文件promtool check web-config web.yml
bash$ promtool check web-config web.yml
web.yml SUCCESS
您可以将多个用户添加到该文件:
shellbasic_auth_users:
    admin: $2b$12$hNf2lSsxfm0.i4a.1kVpSOVyBCfIB51VRjgBUyv6kdnyTlgWj81Ay
    songst: $2b$12$hNf2lSsxfm0.i4a.1kVpSOVyBCfIB51VRjgBUyv6kdnyTlgWj81Ay
启动 Prometheus
您可以使用以下 Web 配置文件启动 prometheus:
bash$ prometheus --web.config.file=web.yml
测试
您可以使用 cURL 与您的设置进行交互。尝试以下请求:
bashcurl --head http://localhost:9090/graph
401 Unauthorized由于您未能提供有效的用户名和密码,因此这将返回响应。
要使用基本身份验证成功访问 Prometheus 端点(例如端点),/metrics请使用标志提供正确的用户名-u,并在提示时提供密码:
bashcurl -u admin http://localhost:9090/metrics
Enter host password for user 'admin':
这应该返回 Prometheus 指标输出,它看起来应该像这样:
bash# HELP go_gc_duration_seconds A summary of the GC invocation durations.
# TYPE go_gc_duration_seconds summary
go_gc_duration_seconds{quantile="0"} 0.0001343
go_gc_duration_seconds{quantile="0.25"} 0.0002032
go_gc_duration_seconds{quantile="0.5"} 0.0004485
...
概括
在本指南中,您将用户名和散列密码存储在一个web.yml文件中,并使用该文件中的凭据对访问 Prometheus 的 HTTP 端点的用户进行身份验证所需的参数启动了 prometheus。
4、Prometheus部署主机时间偏差
Prometheus无法获取数据时,可以排查Prometheus部署主机时间是否出现偏差从而导致无法正确获取指标数据。如果Prometheus服务器的时间偏差太大,它可能会认为目标服务器的指标数据已经过时,或者还未到达预期的抓取时间点,因此不会拉取或记录这些数据。
5、相同告警指标,不同阈值重复告警
本文作者:宋书廷
本文链接:
版权声明:本博客所有文章除特别声明外,均采用 BY-NC-SA 许可协议。转载请注明出处!